Vium is a drug discovery service company aiming to bring drug development into the 21st century. They were searching for a product designer to help them refine their product vision and link the engineering team’s output to company objectives.
They brought me on to lead product design for the team there, and I took up the challenge to build and deliver a commercially viably product in six months. Their core product was a suite of scientific tools to run preclinical drug trials.
The Problem
To start, I examined the problem, the current solutions, and delved into how the current solutions addressed or failed to address the problems.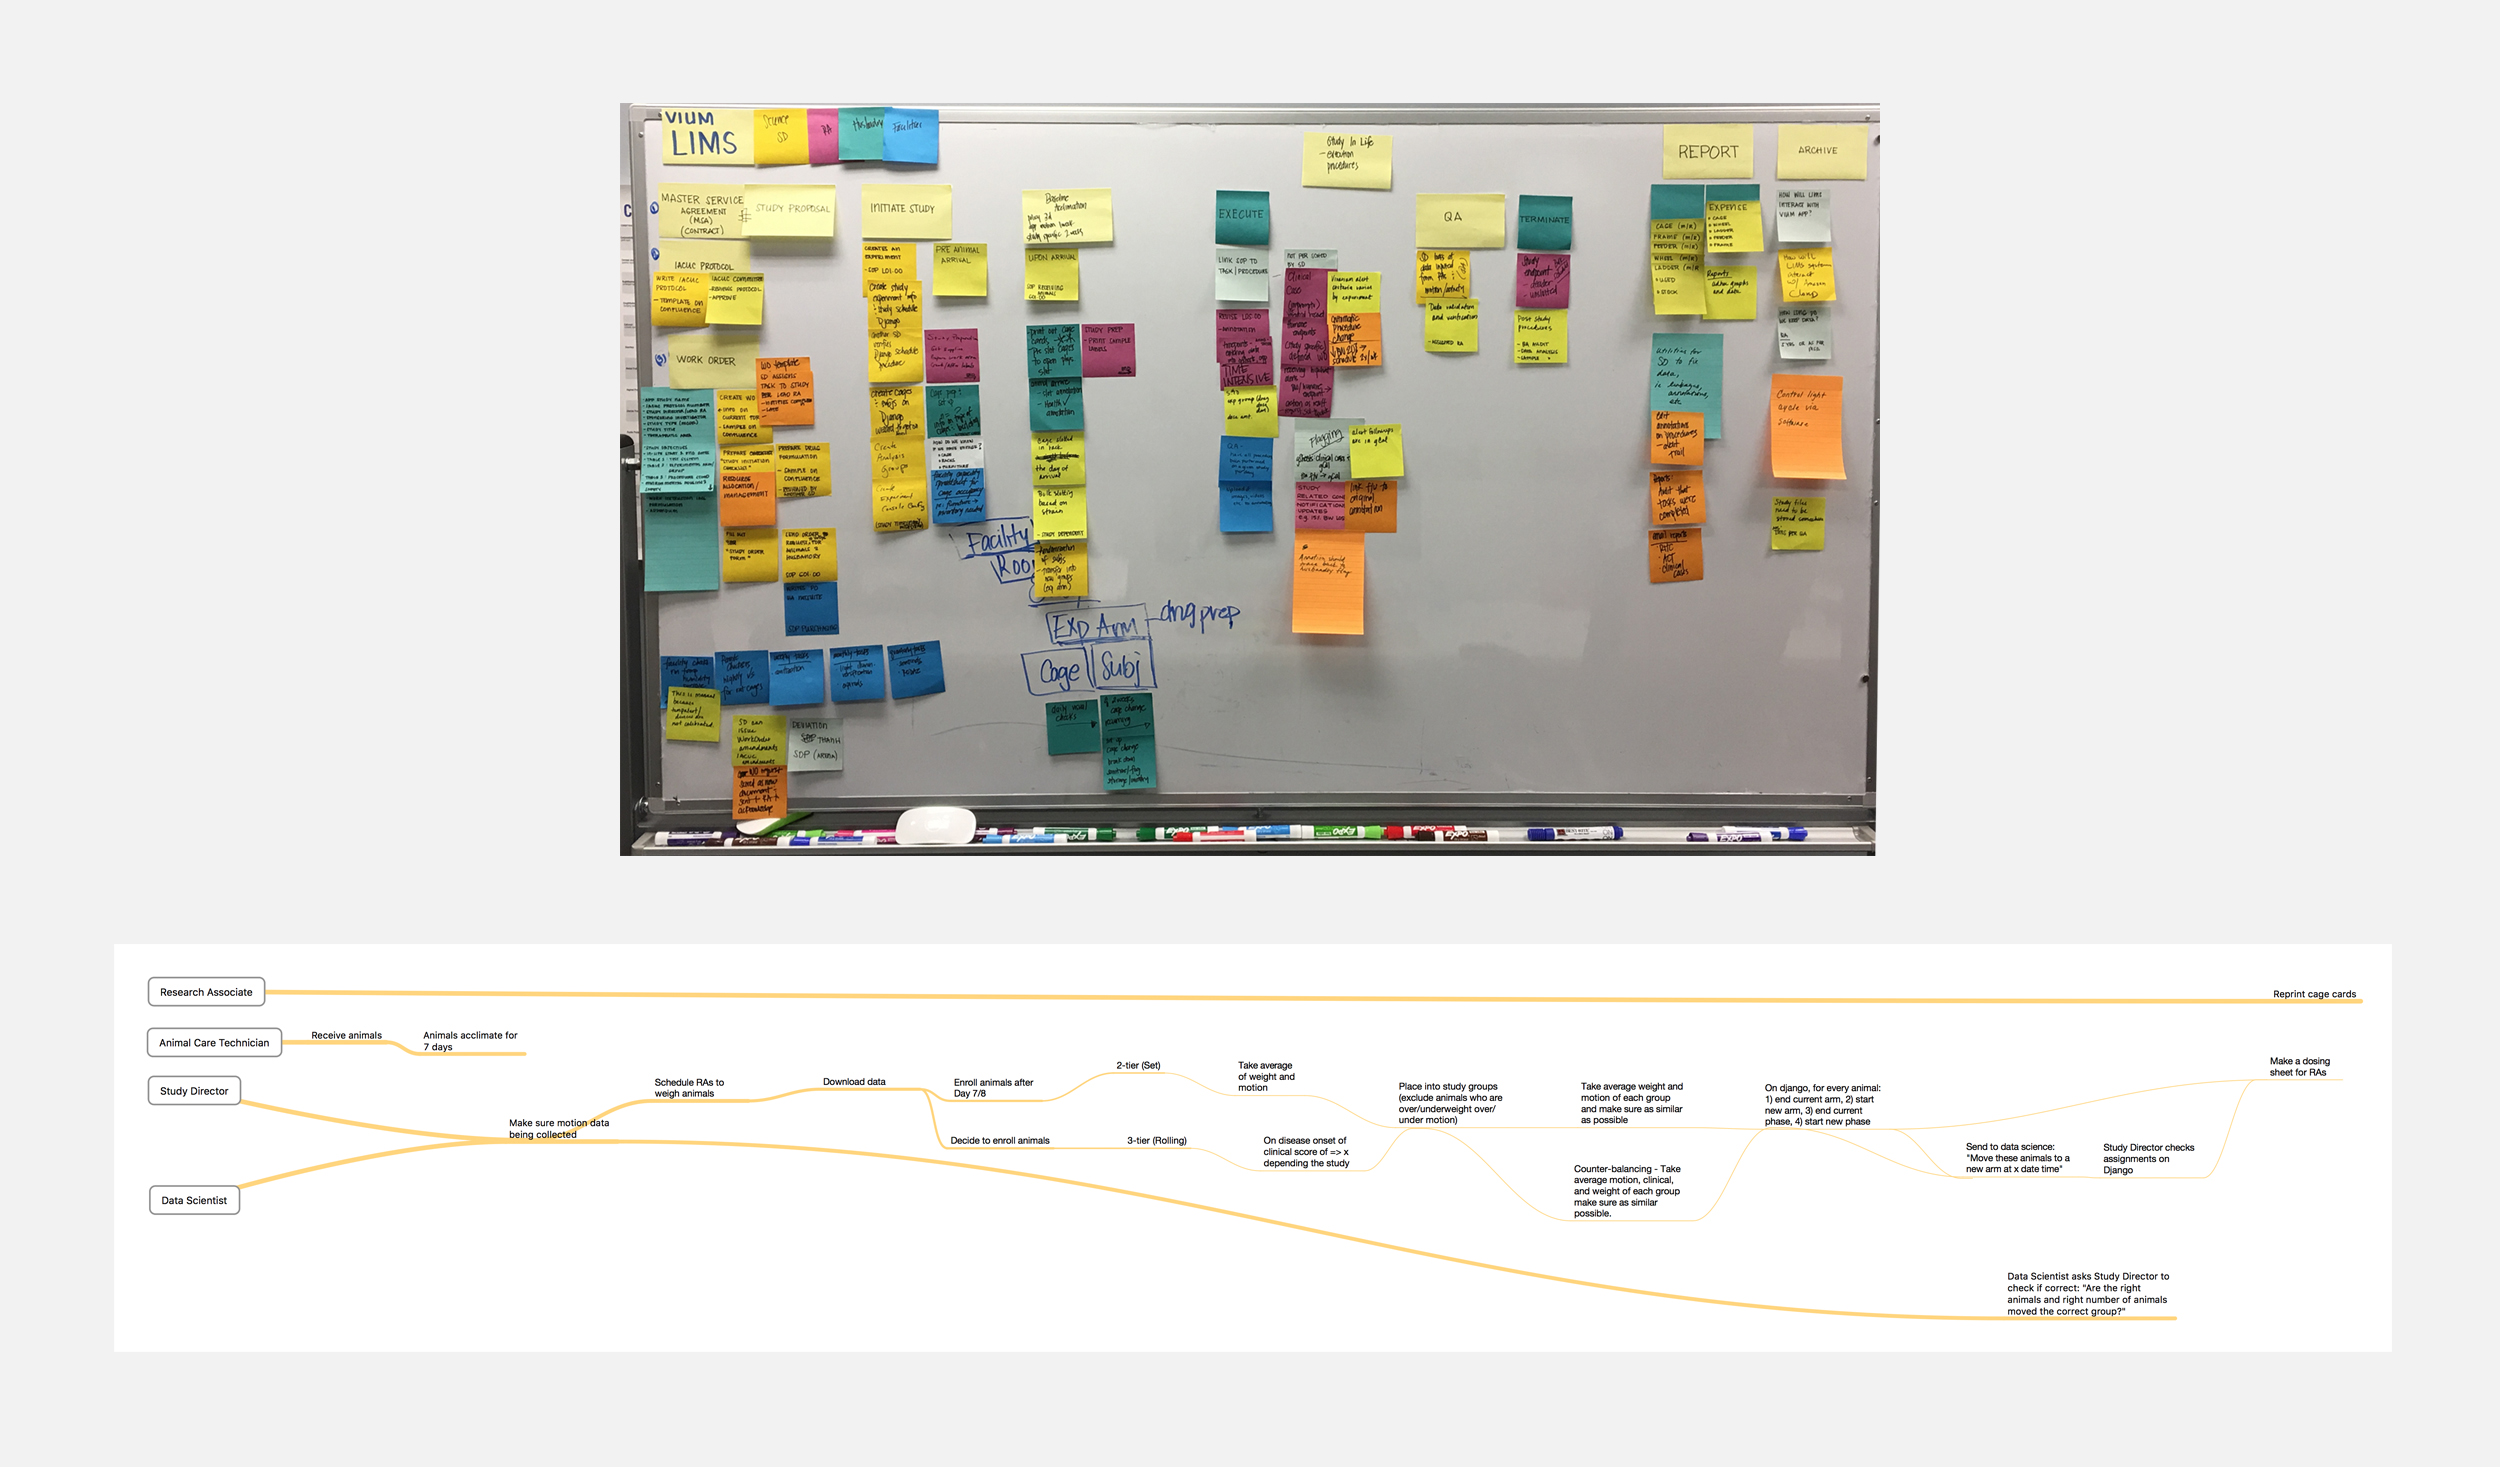
Problem #1: High error rate when entering data
Errors could take place at three levels (1) starting an experiment, (2) running an experiment, and (3) ending an experiment.
| Problem #1 | Current Solution |
|---|---|
| High error rate in data entry | Directors would go through data and flag misentered data. |
The process of entering data was manual and even though directors were checking the data, some errors would go uncaught, escalating to a committee level.
Problem #2: Time spent entering data
| Problem #2 | Current Solution |
|---|---|
| Time spent performing operations to start, run, and end an experiment was long | Many operations were performed manually in either an Excel spreadsheet, a Django admin-like database interface, or a graphical user interface. |
Originally, many operations were performed in Django admin. Some operations were soon moved to a graphical user interface; however, some operations still needed to be completed via the old system. Data that did not fit in either the old system or the new graphical user interface went in a spreadsheet.
Problem #3: Team was not delivering products that matched user needs
| Problem #3 | Current Solution |
|---|---|
| Process management - The team was not delivering products that aligned with company objectives | All feature requests were made to the Lead Engineer. |
There were several instances in which the team spent 3-6 months engineering a product, only to deliver a product they later learn that the product was unusable. For example, the team had spent 4 months building a tool to help expedite the collection of drug dosing data
Defining Success Metrics
With an understanding of the problems, I defined key metrics to evaluate the success of our product. These are defined respective to the above problems:
- Average number of errors per non-errors completing x task
- Time spent completing x task
- Satisfaction level of users
What are the tasks exactly? While we have developed a high level view of the problems, we need to do some deeper digging to avoid prematurely designing solutions.
The Design Process
Step 1: Map the user flow
I worked with scientists, study directors, and engineers and asked them to describe the process of running a drug trial. It was a messy and complex system, but after an hour of discussion, I was able to lead the team to create a simple map:
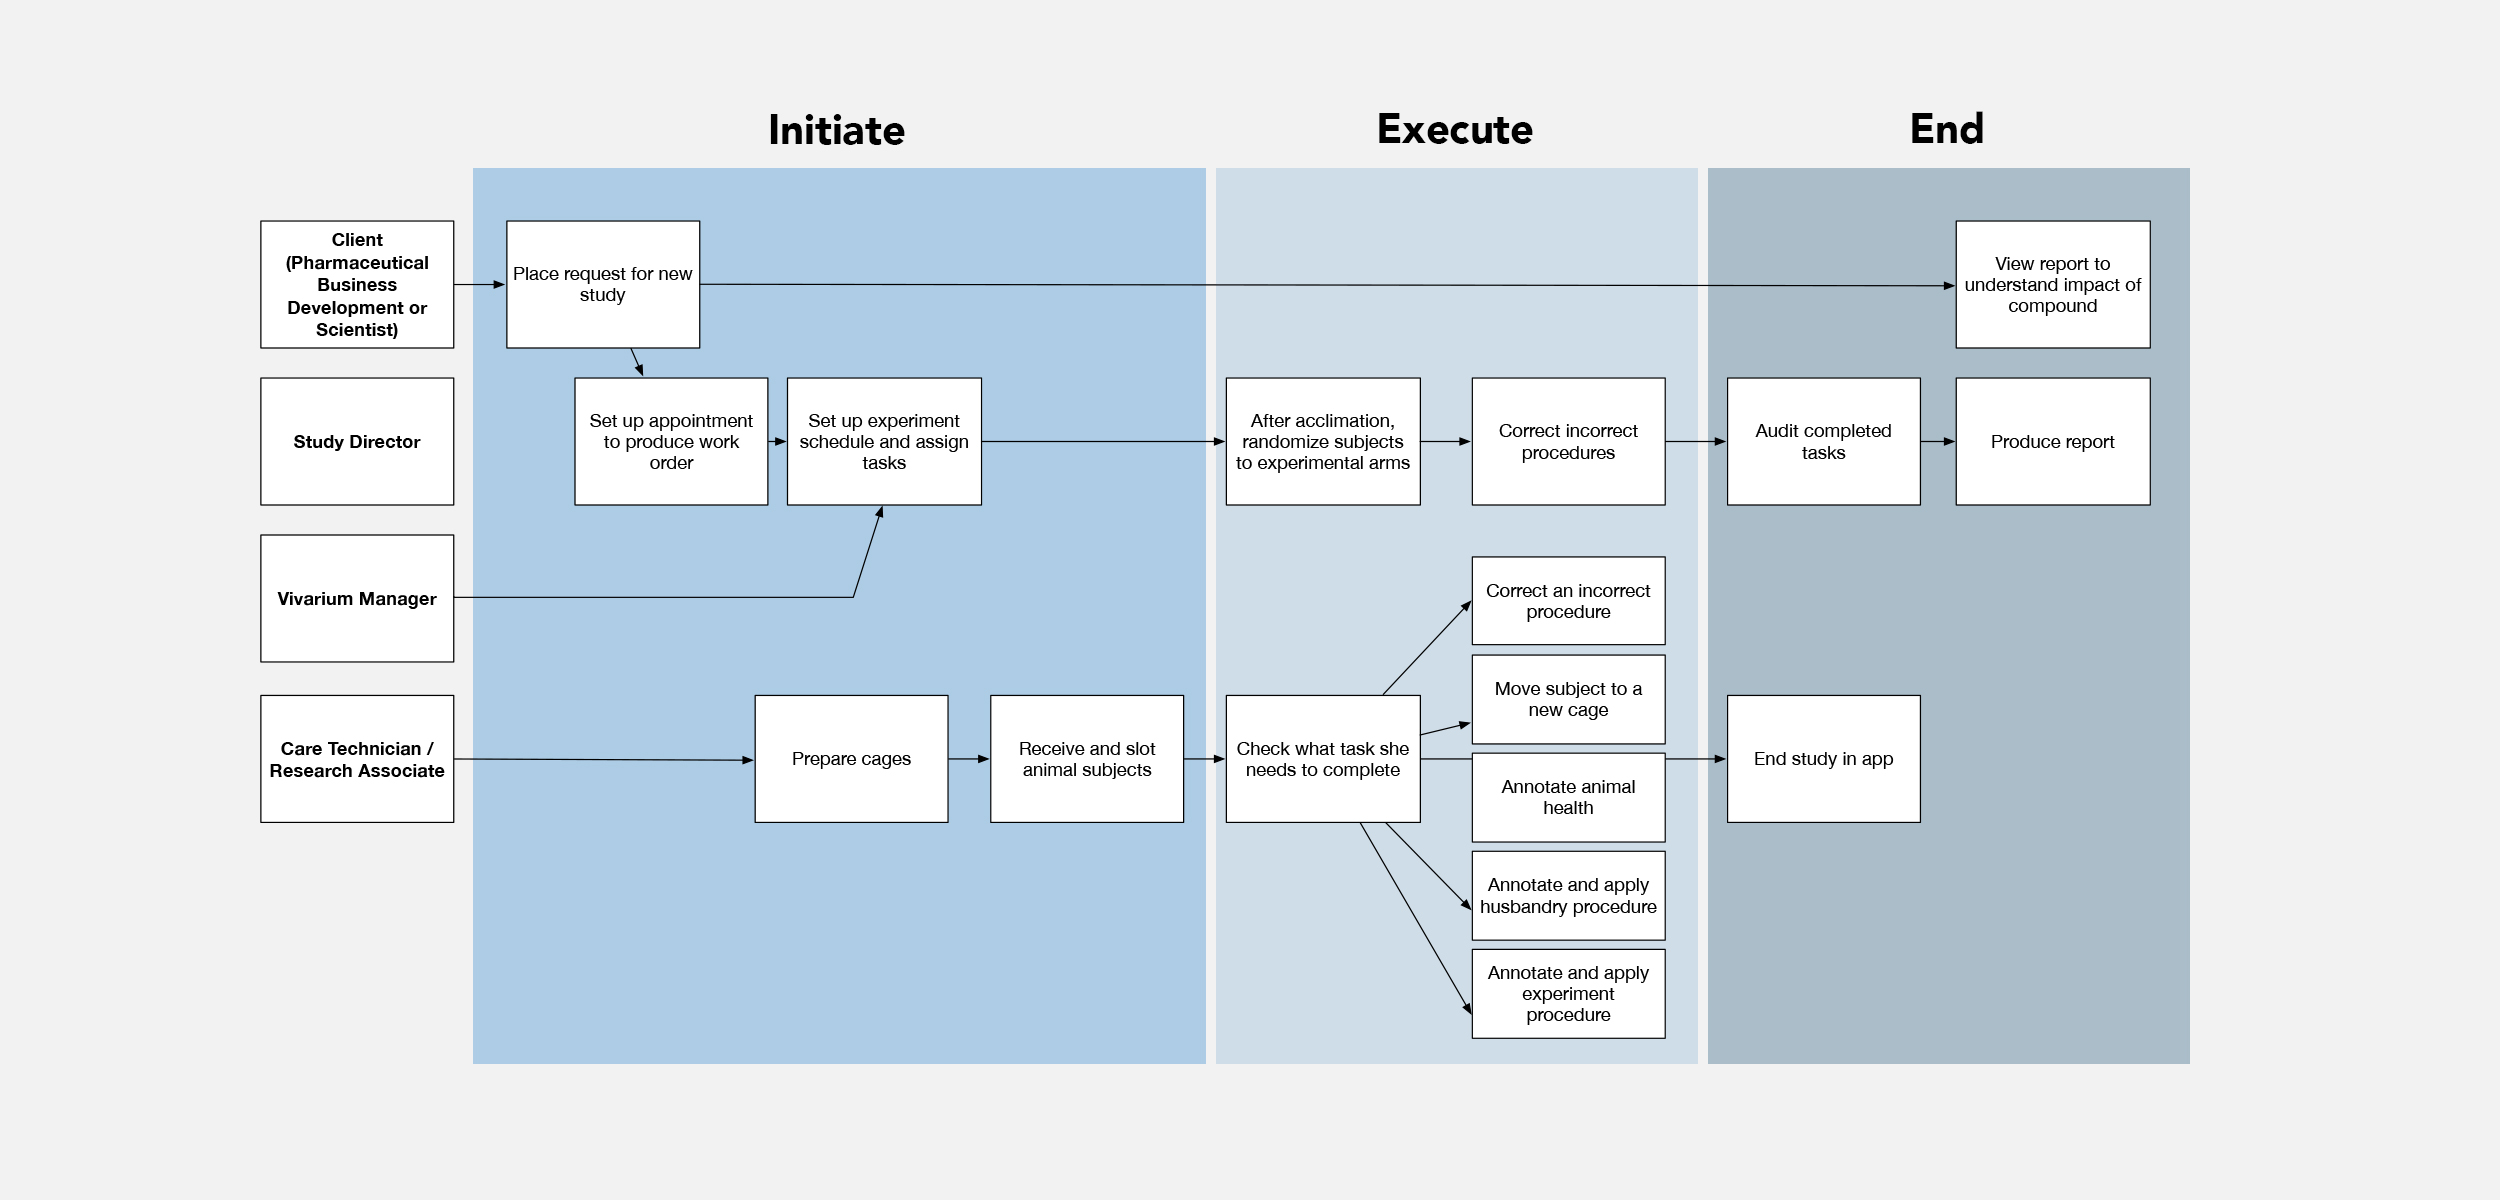
The process had three main pieces:
- Initiate an experiment
- Execute an experiment
- Terminate an experiment
The map was customer-centric, allowing us to identify each stakeholder’s role in the process. There were four main groups:
- Pharmaceutical scientist (the customer)
- Study director: oversaw all study operations
- Vivarium Manager: oversaw all lab operations
- Research Associates and Animal Care Technicians: executed on study and lab operations
It’s great to interview experts, but it’s not enough. As a product designer, I also needed to look beyond what users said to see hidden needs and deeper goals. When one of my mentors was designing Pages at Apple, he spent weeks reading a book and then writing a book report. Designing for himself was an important part of building a product. When you rely on customers, you can only build according to their perspective of the world, which leads you to incrementally solve pieces of the problem, at the expense of the root problem. In order to deeply understand the problem, I also helped initiate new studies and run current studies.
The user map, combined with firsthand experience, allowed us to identify the key gaps and inefficiencies to be tackled.
Step 2: Identify key inefficiencies and quantify them
The next step in the process was measuring each of these operations to evaluate how to prioritize each feature.
Current metrics
| Feature | Current time spent | Current error rate | Current satisfaction level |
|---|---|---|---|
| Set up an experiment | 0.75-2 hrs | 9% | 2/5 |
| Randomize experimental subjects | 4-5 hrs | 12% | 1/5 |
| Assign 20 subjects to a cage | 0.4 hrs | 2% | 3/5 |
| Annotate observations for 20 subjects | 1.1 hrs | 24% | 3/5 |
| Perform a quality check on experimental data | 2-3 hrs | 8% | 1/5 |
Next we also needed to define success.
Current metrics with Target metrics
| Feature | Current time spent | Target time spent | Current error rate | Target error rate | Current satisfaction level | Target satisfaction level |
|---|---|---|---|---|---|---|
| Set up an experiment | 0.75-2 hrs | 0.2 hrs | 9% | 5% | 2/5 | 4/5 |
| Randomize experimental subjects | 4-5 hrs | 1 hr | 12% | 5% | 1/5 | 4/5 |
| Assign 20 subjects to a cage | 0.4 hrs | 0.2 hrs | 10% | 2% | 3/5 | 4/5 |
| Annotate observations for 20 subjects | 1.1 hrs | 0.75 hrs | 24% | 10% | 3/5 | 4/5 |
| Perform a quality check on experimental data | 4-5 hrs | 3 hours | 8% | 5% | 1/5 | 3/5 |
Step 3: Prioritize the roadmap
A prioritization needs to be sympathetic to the resource constraints of the organization and the objectives. This is especially important in a startup environment with limited resources.
While revamping the app for a mobile experience that uses QR codes to scan cage racks and rapidly enter information about subjects would have been a cooler and more efficient way to run experiments, we were under business constraints to deliver a product in 6 months and did not have the bandwidth to completely turn around our way of performing lab operations.
Essentially, I prioritized our roadmap by evaluating the impact/strategic alignment vs. cost/risk of each feature:
| Feature | Business value | Implementation effort | Risk |
|---|---|---|---|
| 1. Set up an experiment | 1 | 1 | 4 |
| 2. Randomize experimental subjects | 3 | 3 | 1 |
| 3. Assign 20 subjects to a cage | 4 | 4 | 1 |
| 4. Annotate observations for 20 subjects | 4 | 4 | 1 |
| 5. Perform a quality check on experimental data | 2 | 3 | 1 |
(Out of 5)
The data entry features (3, 4) had the highest business value, so we worked to implement that piece first.
Step 4: Design
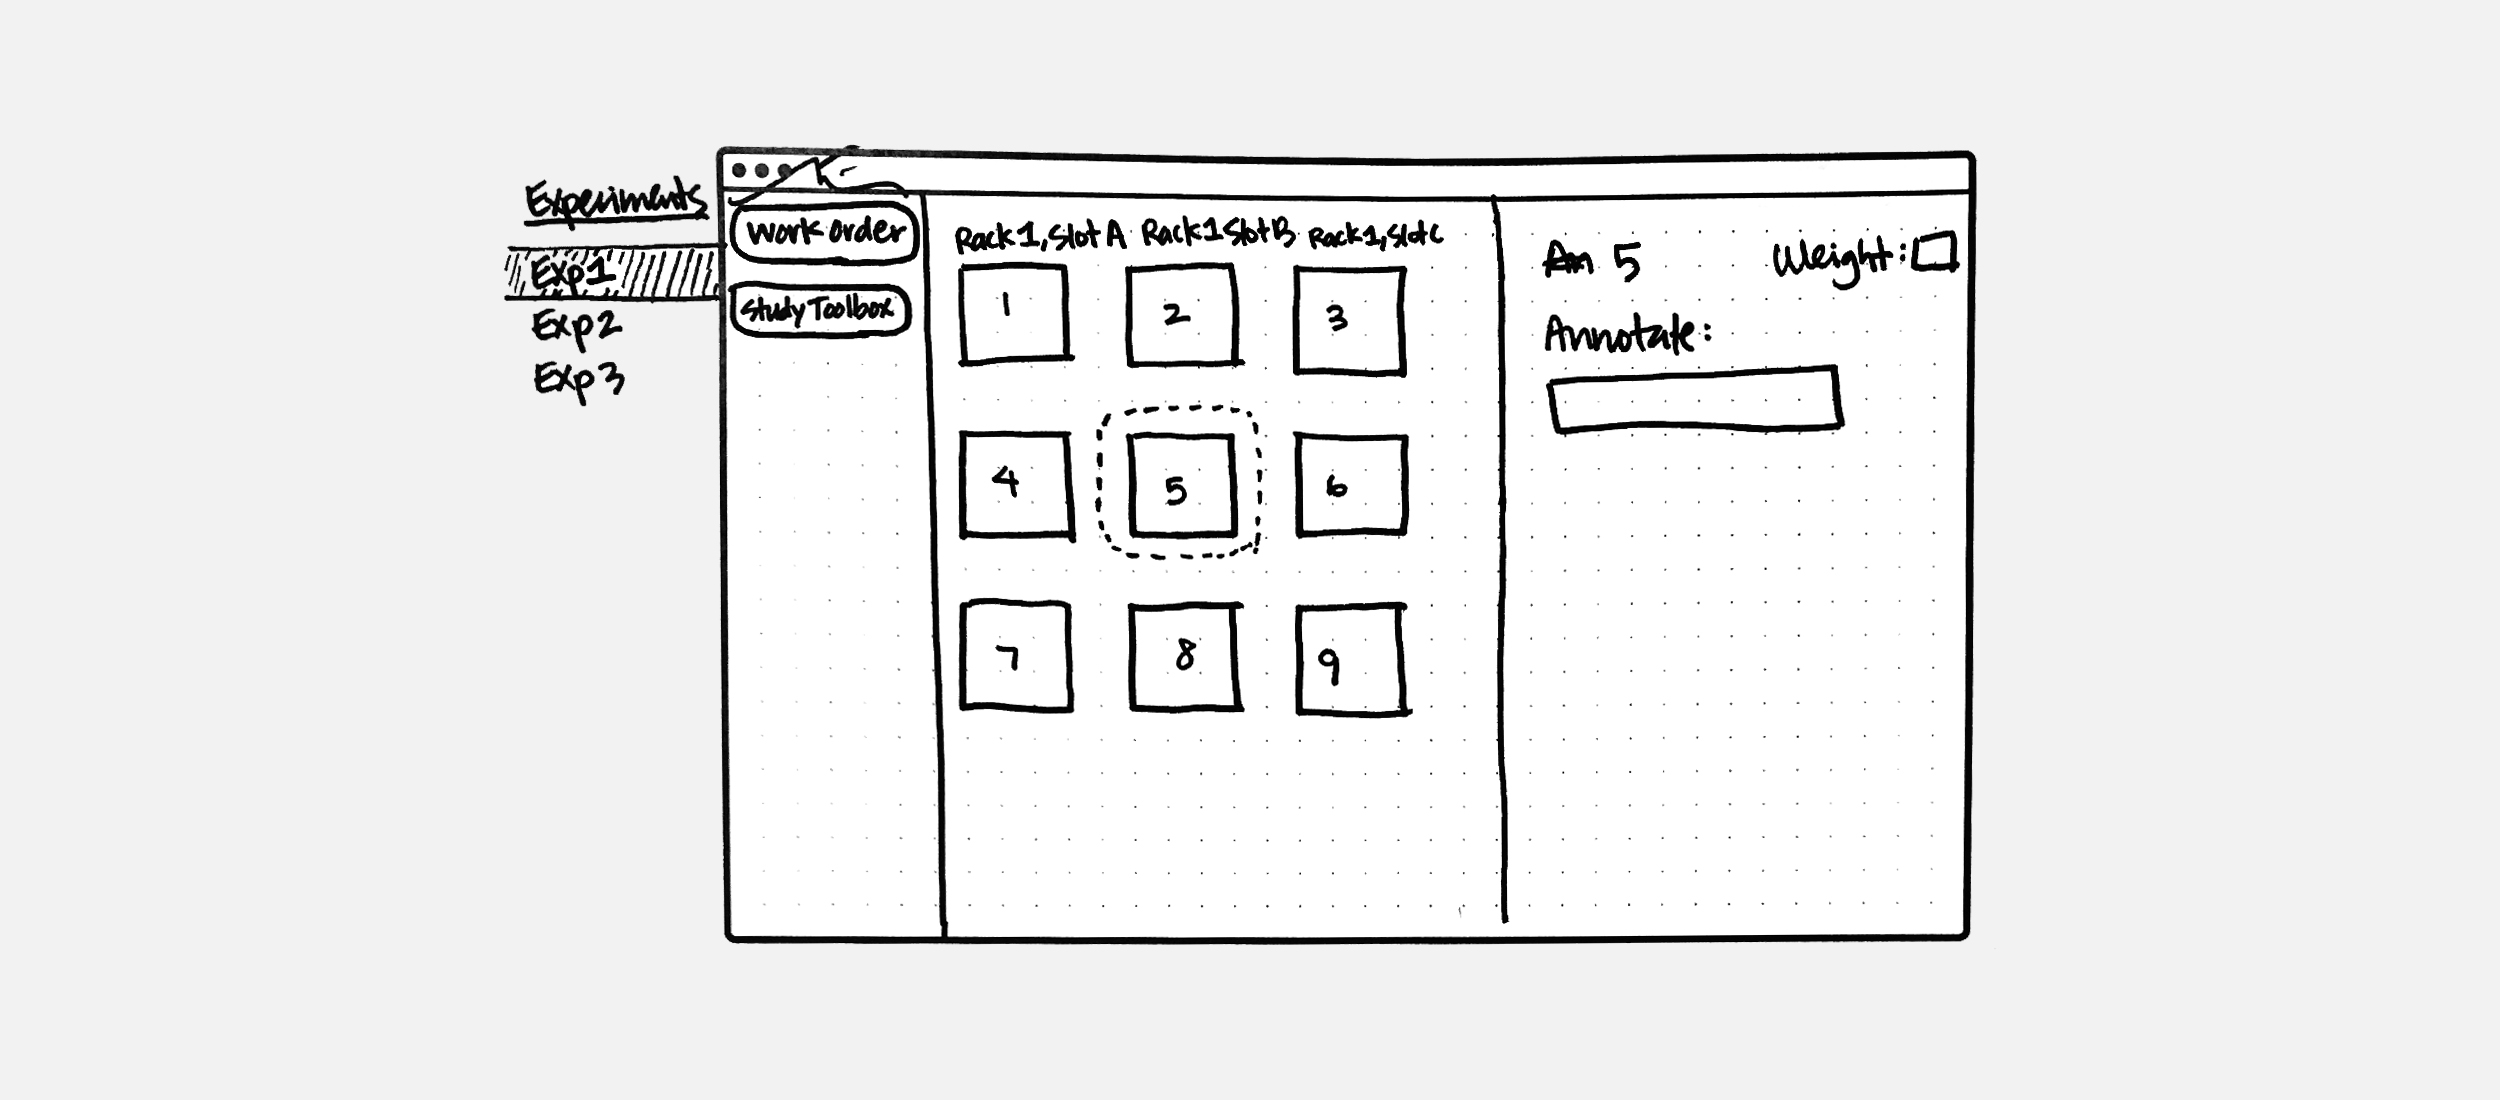
Now that we had our roadmap in place and we knew the first feature on the roadmap, we began sketching and gradually producing mock-ups of higher fidelity.
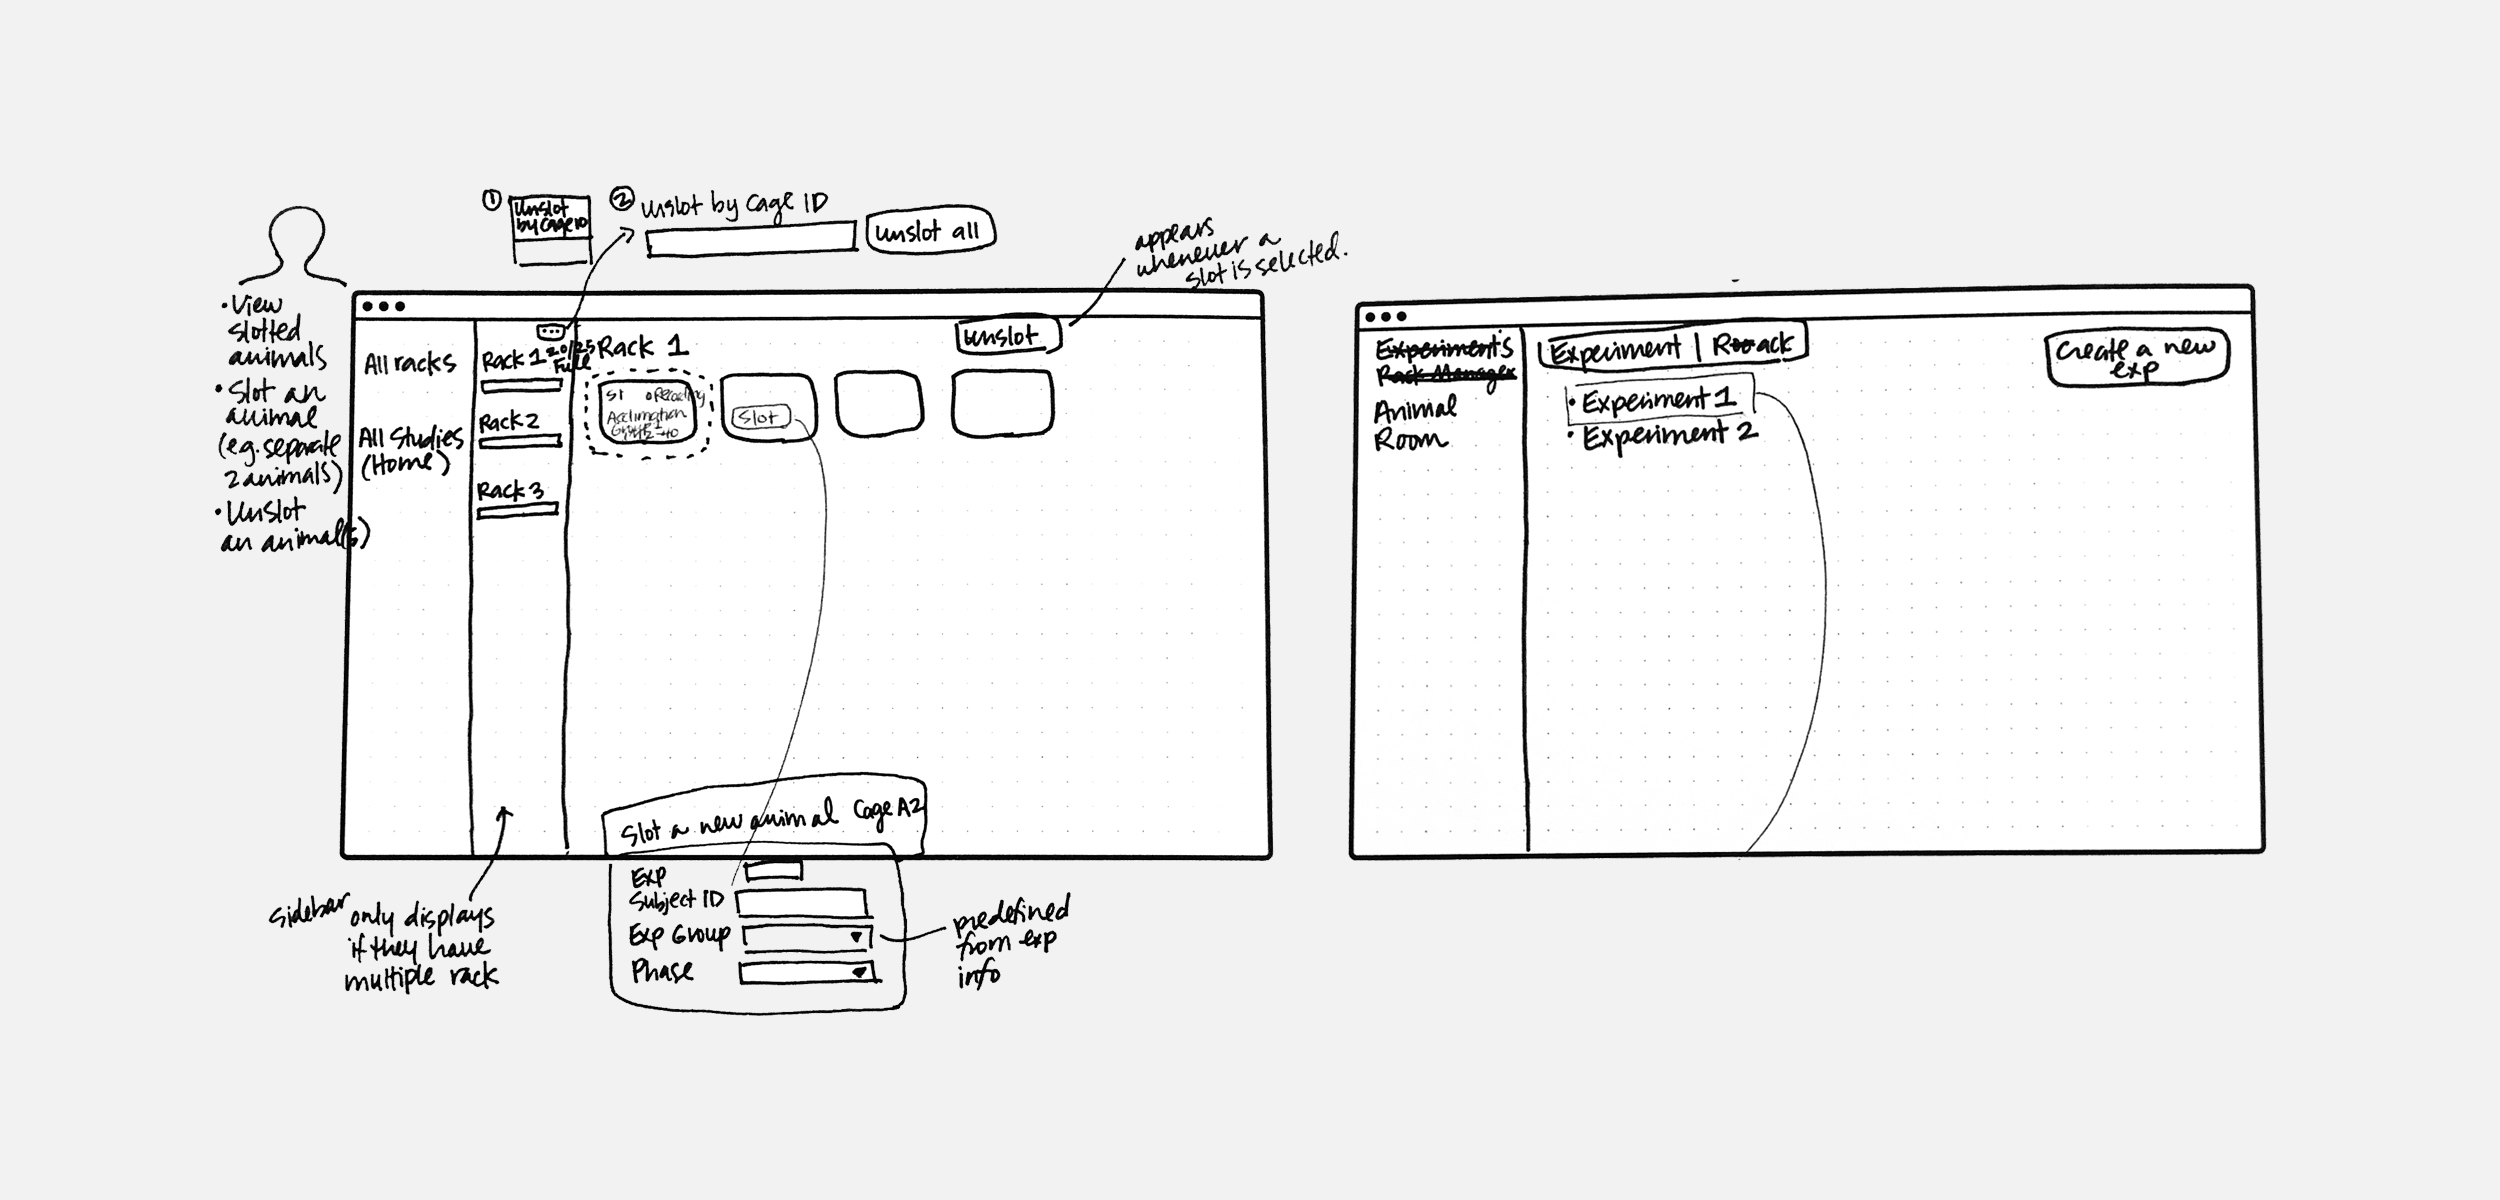
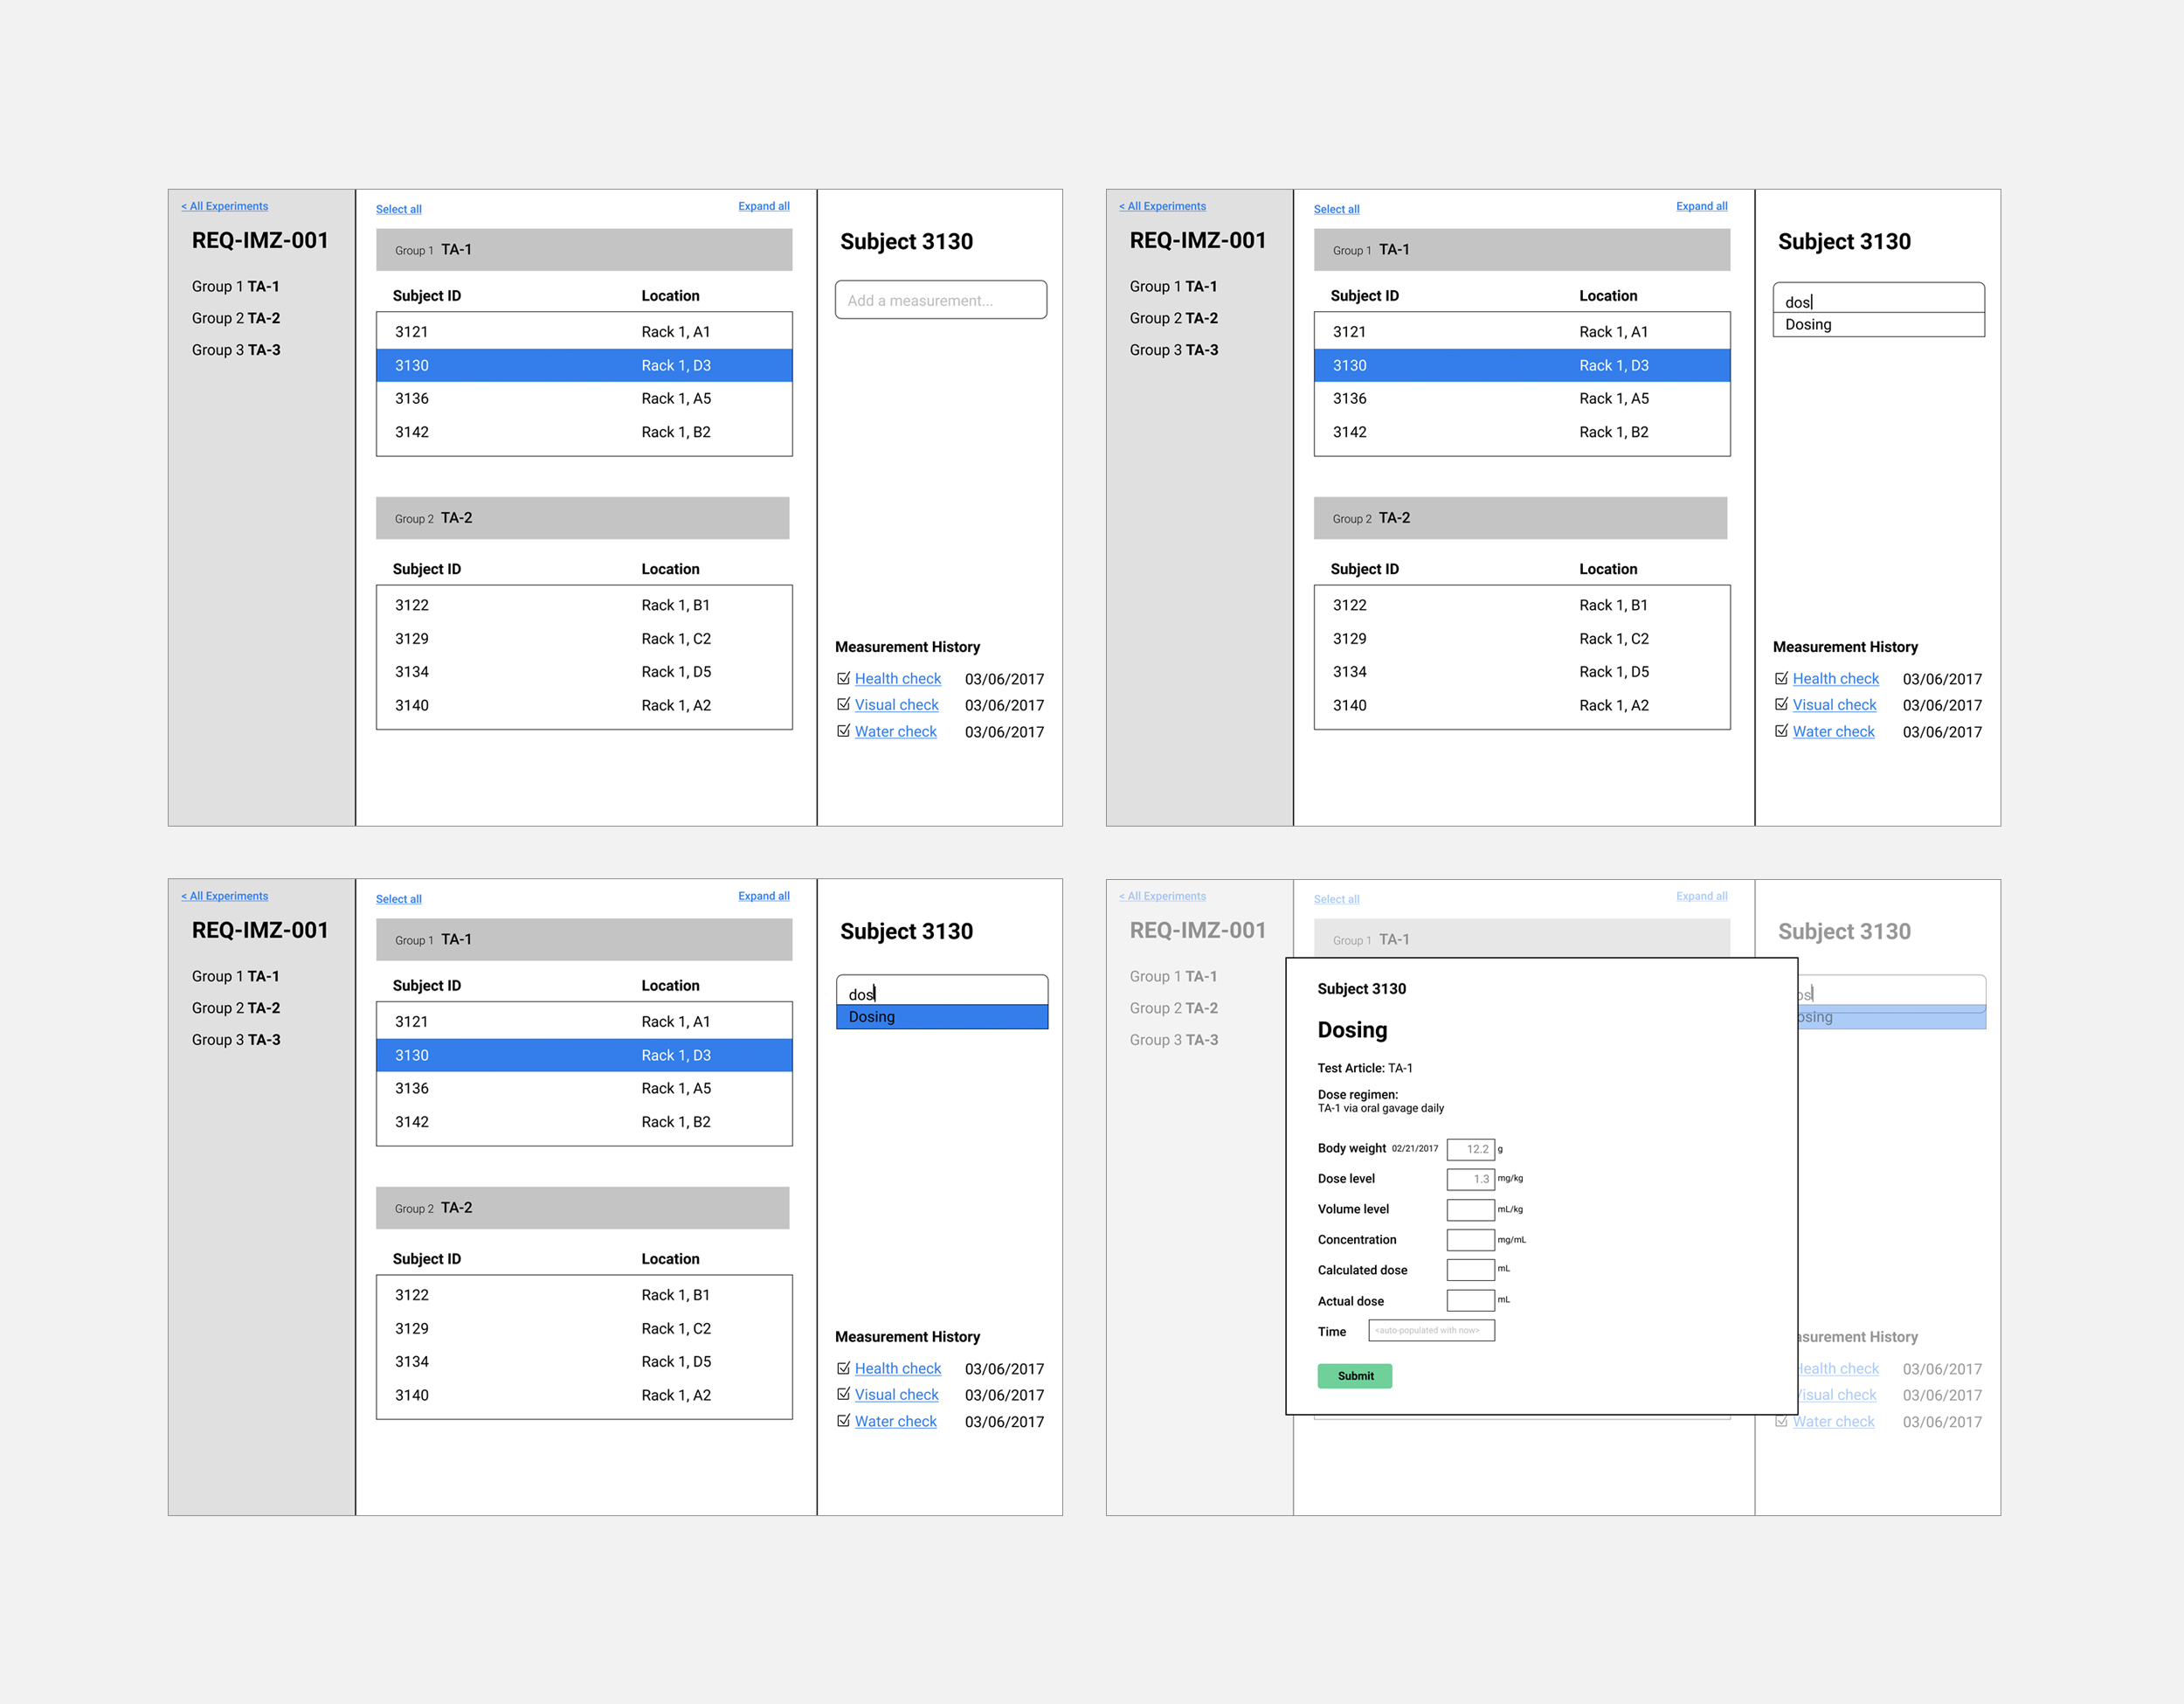
For each of the major product features, I drafted hypotheses and took an iterative approach to design. Each wireframe was aimed at proving/disproving some hypothesis. Do scientists annotate their subjects in the sequence of xyz? Do they administer treatments in bulk or does each subject receive a different treatment?
For this sketch, my hypothesis was that scientists annotated one subject at a time.
Wireframe
When I interviewed scientists, I learned that they often applied the same annotation to dozens of subjects and having a means of selecting multiple subjects and annotating all of them at once would expedite operations.
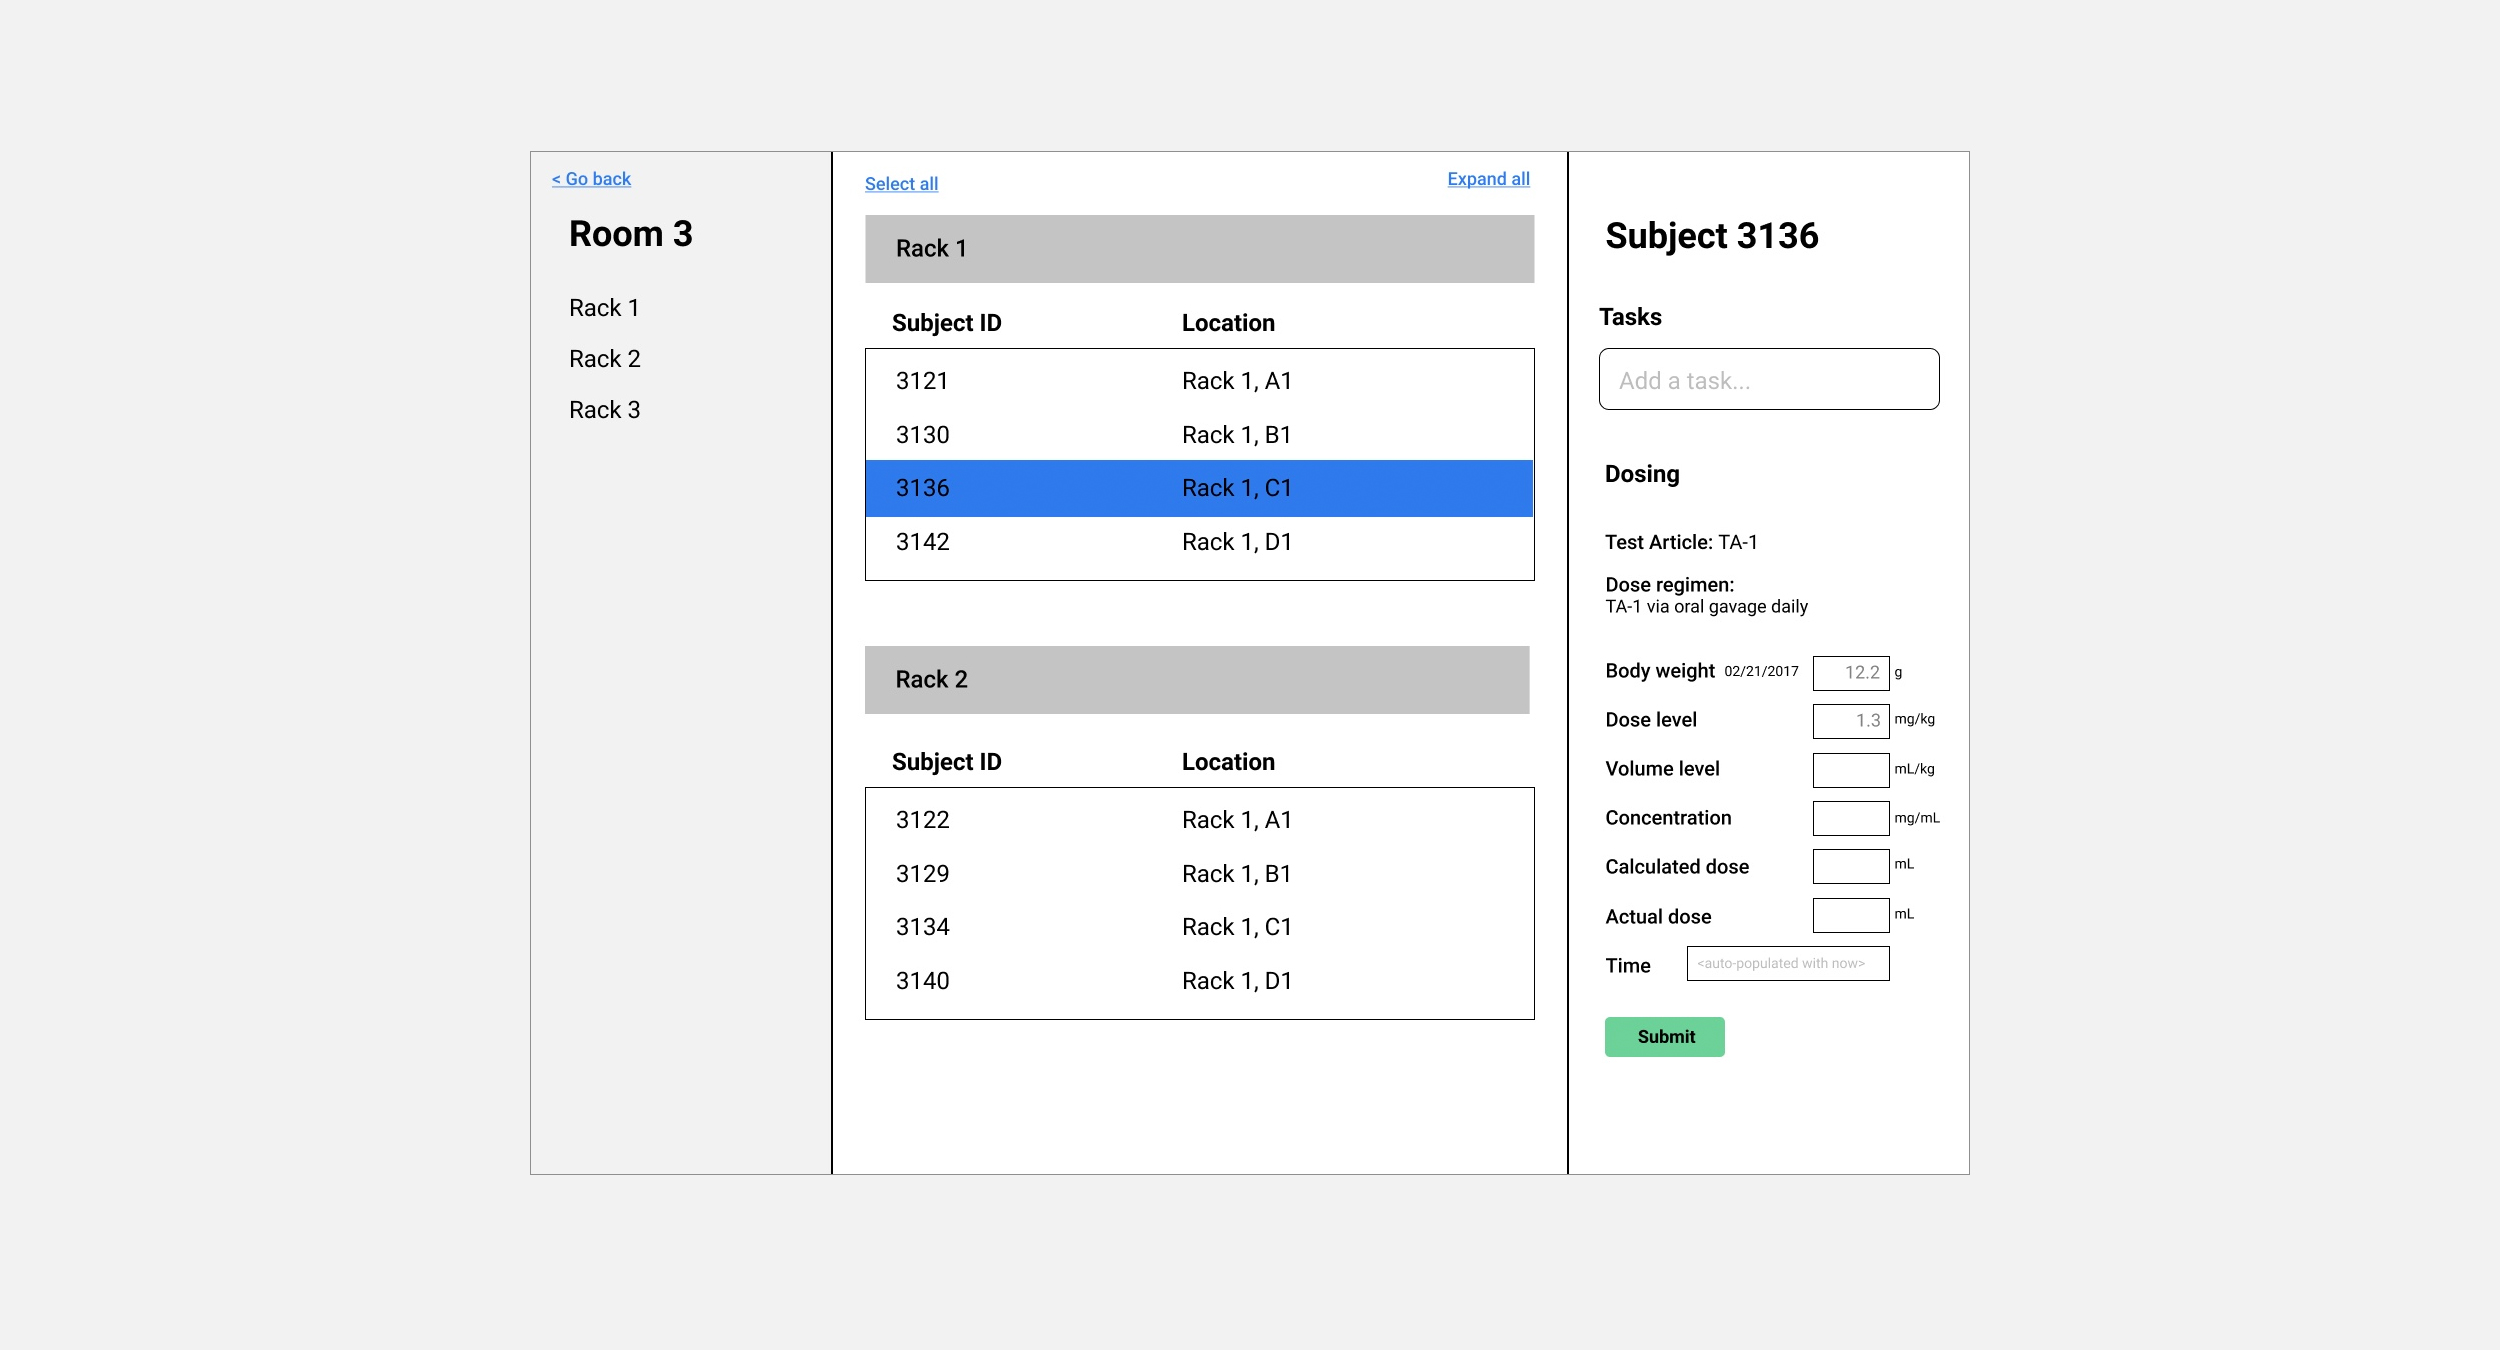
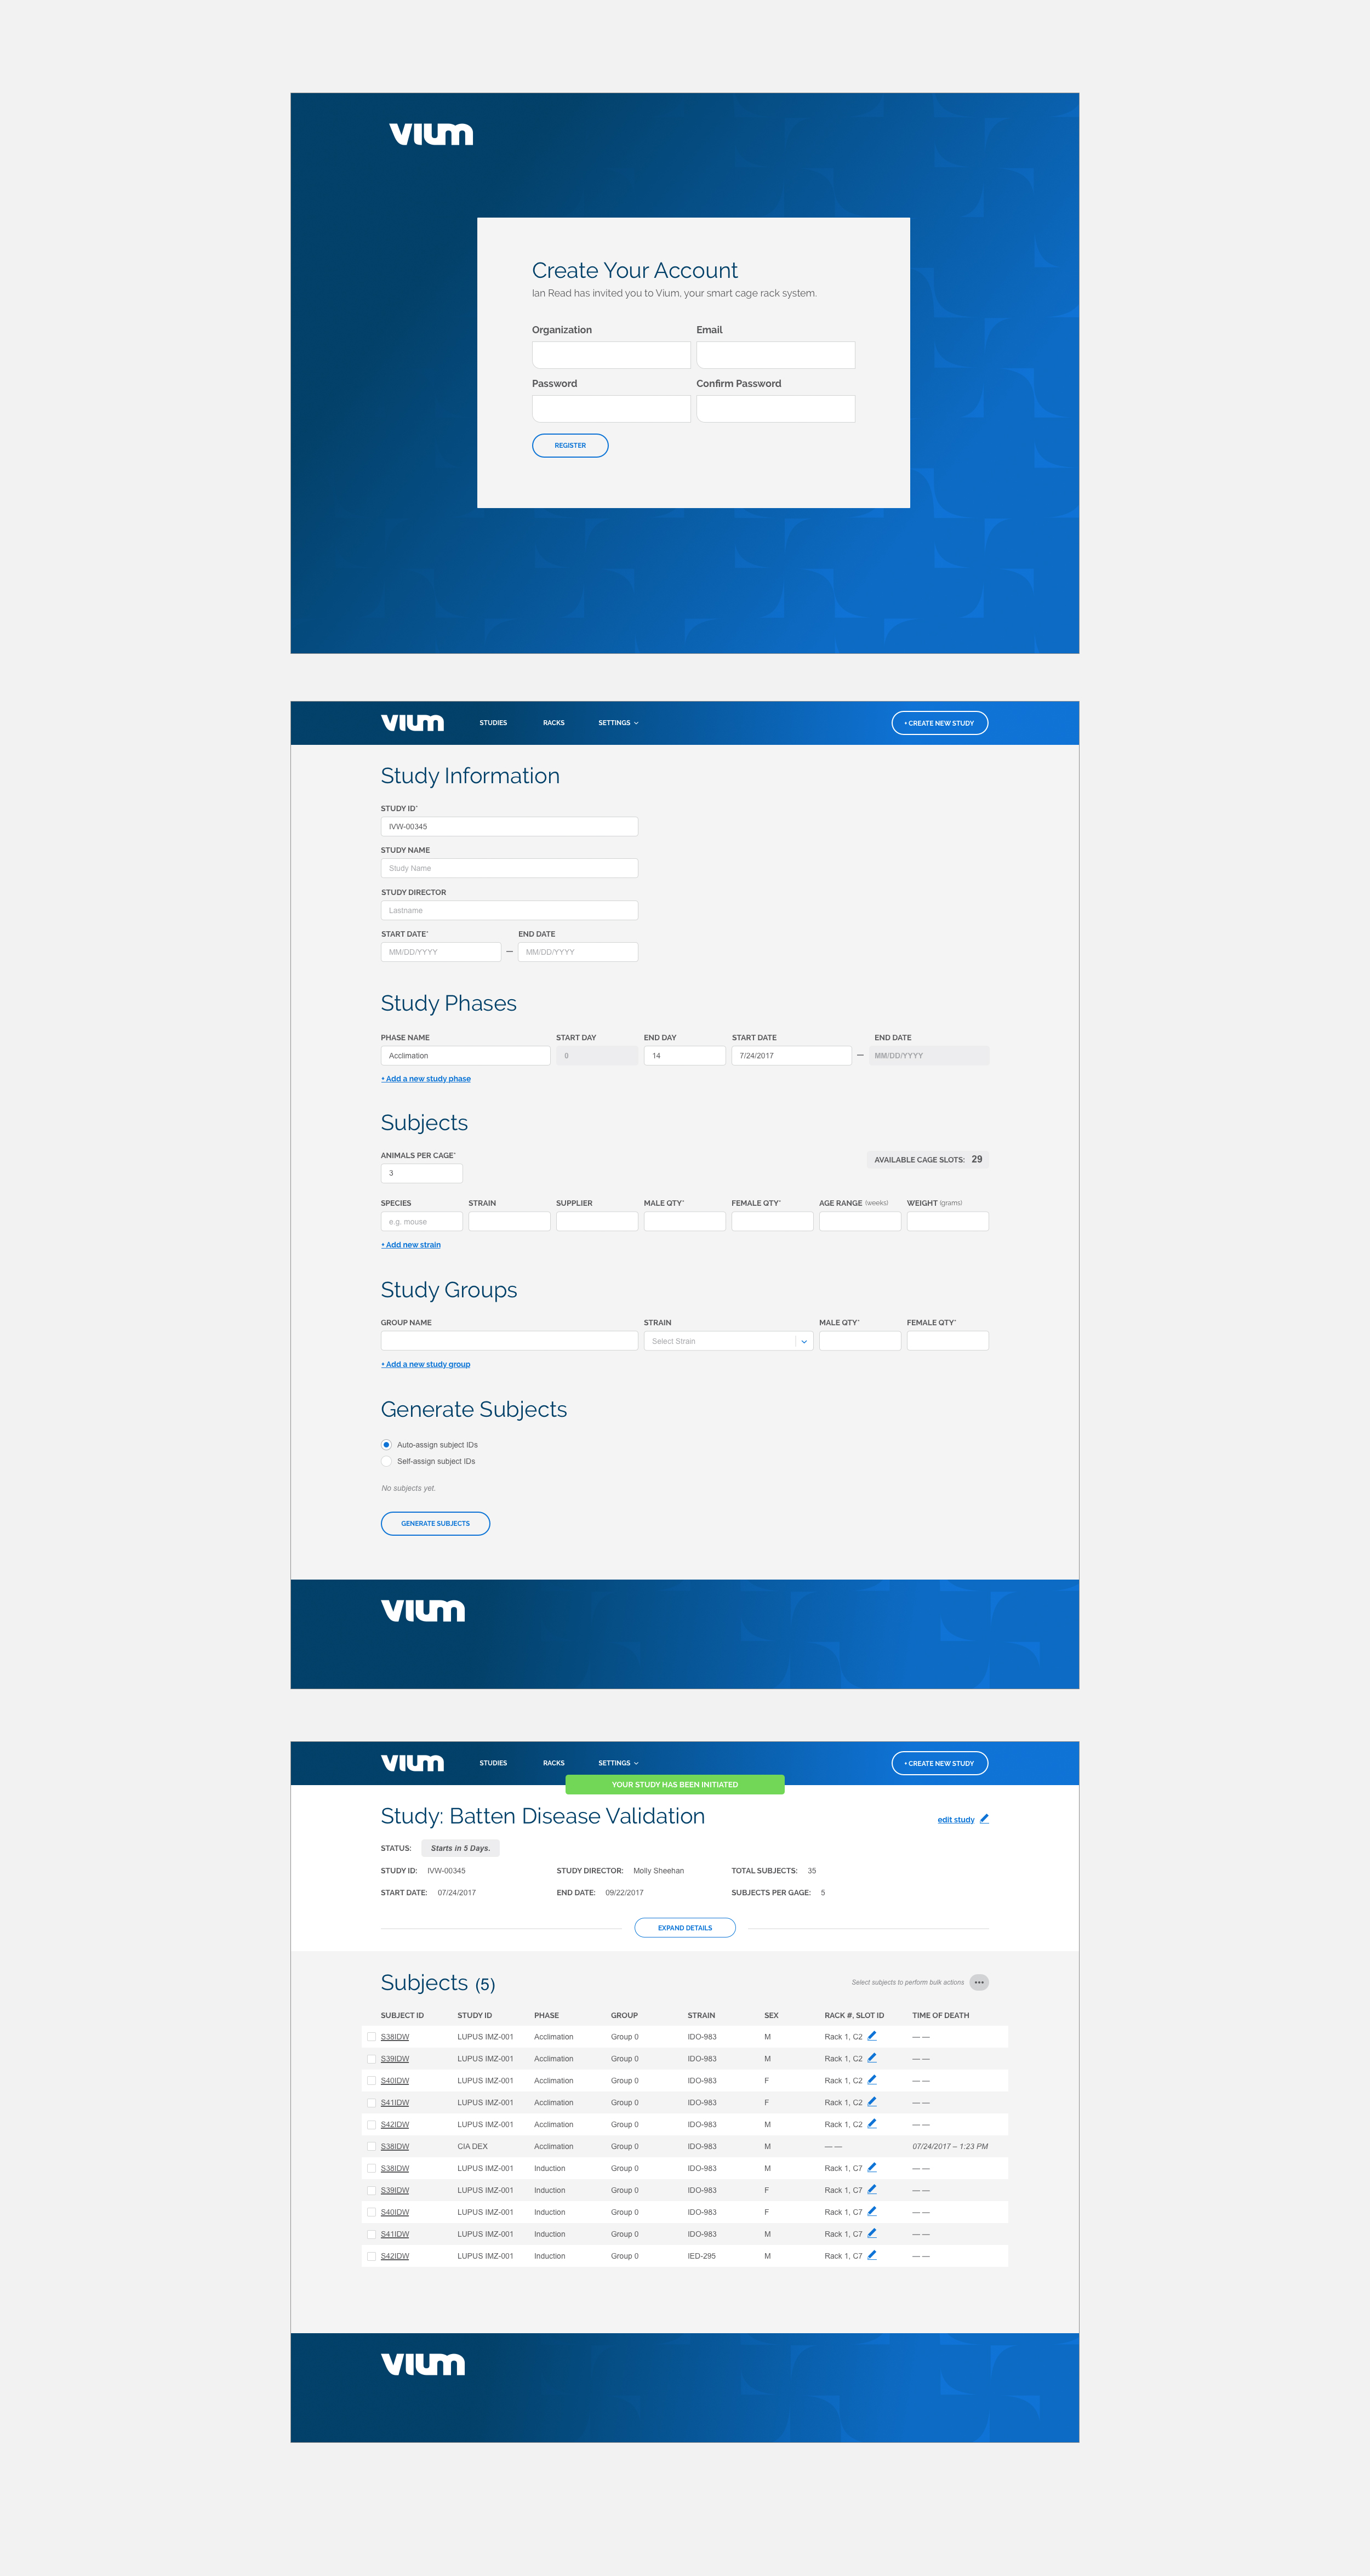
Final
For each feature, I sketched a rough prototype, performed user testing (described below), and as I grew more confident of each, I moved to more granular levels of design.
Step 5: Execute
My job wasn’t done once the engineers started coding. During implementation, I kept track of how the project was going and made adjustments. There were three types of situations that came up during implementation:
1) Our front-end engineer was blocked because he was waiting for back-end endpoints. In this case, I needed to find other tasks for the engineer (usually through keeping an organized product backlog so that he could pull the next one), and in the meantime, work with our back-end engineer to get the work finished more promptly.
2) Sometimes, an implementation of a feature was harder than anticipated, and I needed to look for ways to change the feature to make it easier to implement. In our re-design process, this was especially true when a UI design feature didn’t play well with the database architecture. For example, in setting up a new experiment, the design allowed the user to freely enter data about lab materials and the company that was supplying the material at her own leisure. The database schema, however, required that the user first enter the supplier, and then choose from a list of materials. I worked with our lead engineer to make such features easier to implement.
3) Gather feedback and report bugs on early versions of the product. Sometimes a feature that made sense during the design phase did not work as well as expected in our early feedback sessions. For example, a cage rack view looked good when you had a few racks, but could be overwhelming when you had many racks.
User testing
In addition to dogfooding early versions, I also conducted usability studies and asked directors, scientists, and researchers to try out early prototypes of new features. I gave them a goal, e.g. "Create a new study," or "Assign 20 subjects to a new cage," and the participant would use the prototype to accomplish the goal. During these studies, I gathered success metrics and compared them to our benchmark from those using the old interface, which gave me information about how successful a new feature was. The final outcomes are documented below.
Outcomes
| Feature | Previous time spent | Final time spent | Previous error rate | Final error rate | Previous satisfaction level | Final satisfaction level |
|---|---|---|---|---|---|---|
| Set up an experiment | 0.75-2 hrs | 0.2 hrs | 9% | 7% | 2/5 | 4/5 |
| Randomize experimental subjects | 4-5 hrs | 0.8 hrs | 12% | 6% | 1/5 | 4/5 |
| Assign 20 subjects to a cage | 0.4 hrs | 0.1 hrs | 10% | 3% | 3/5 | 4/5 |
| Annotate observations for 20 subjects | 1.1 hrs | 0.8 hrs | 24% | 9% | 3/5 | 4/5 |
| Perform a quality check on experimental data | 4-5 hrs | - | 8% | - | 1/5 | - |
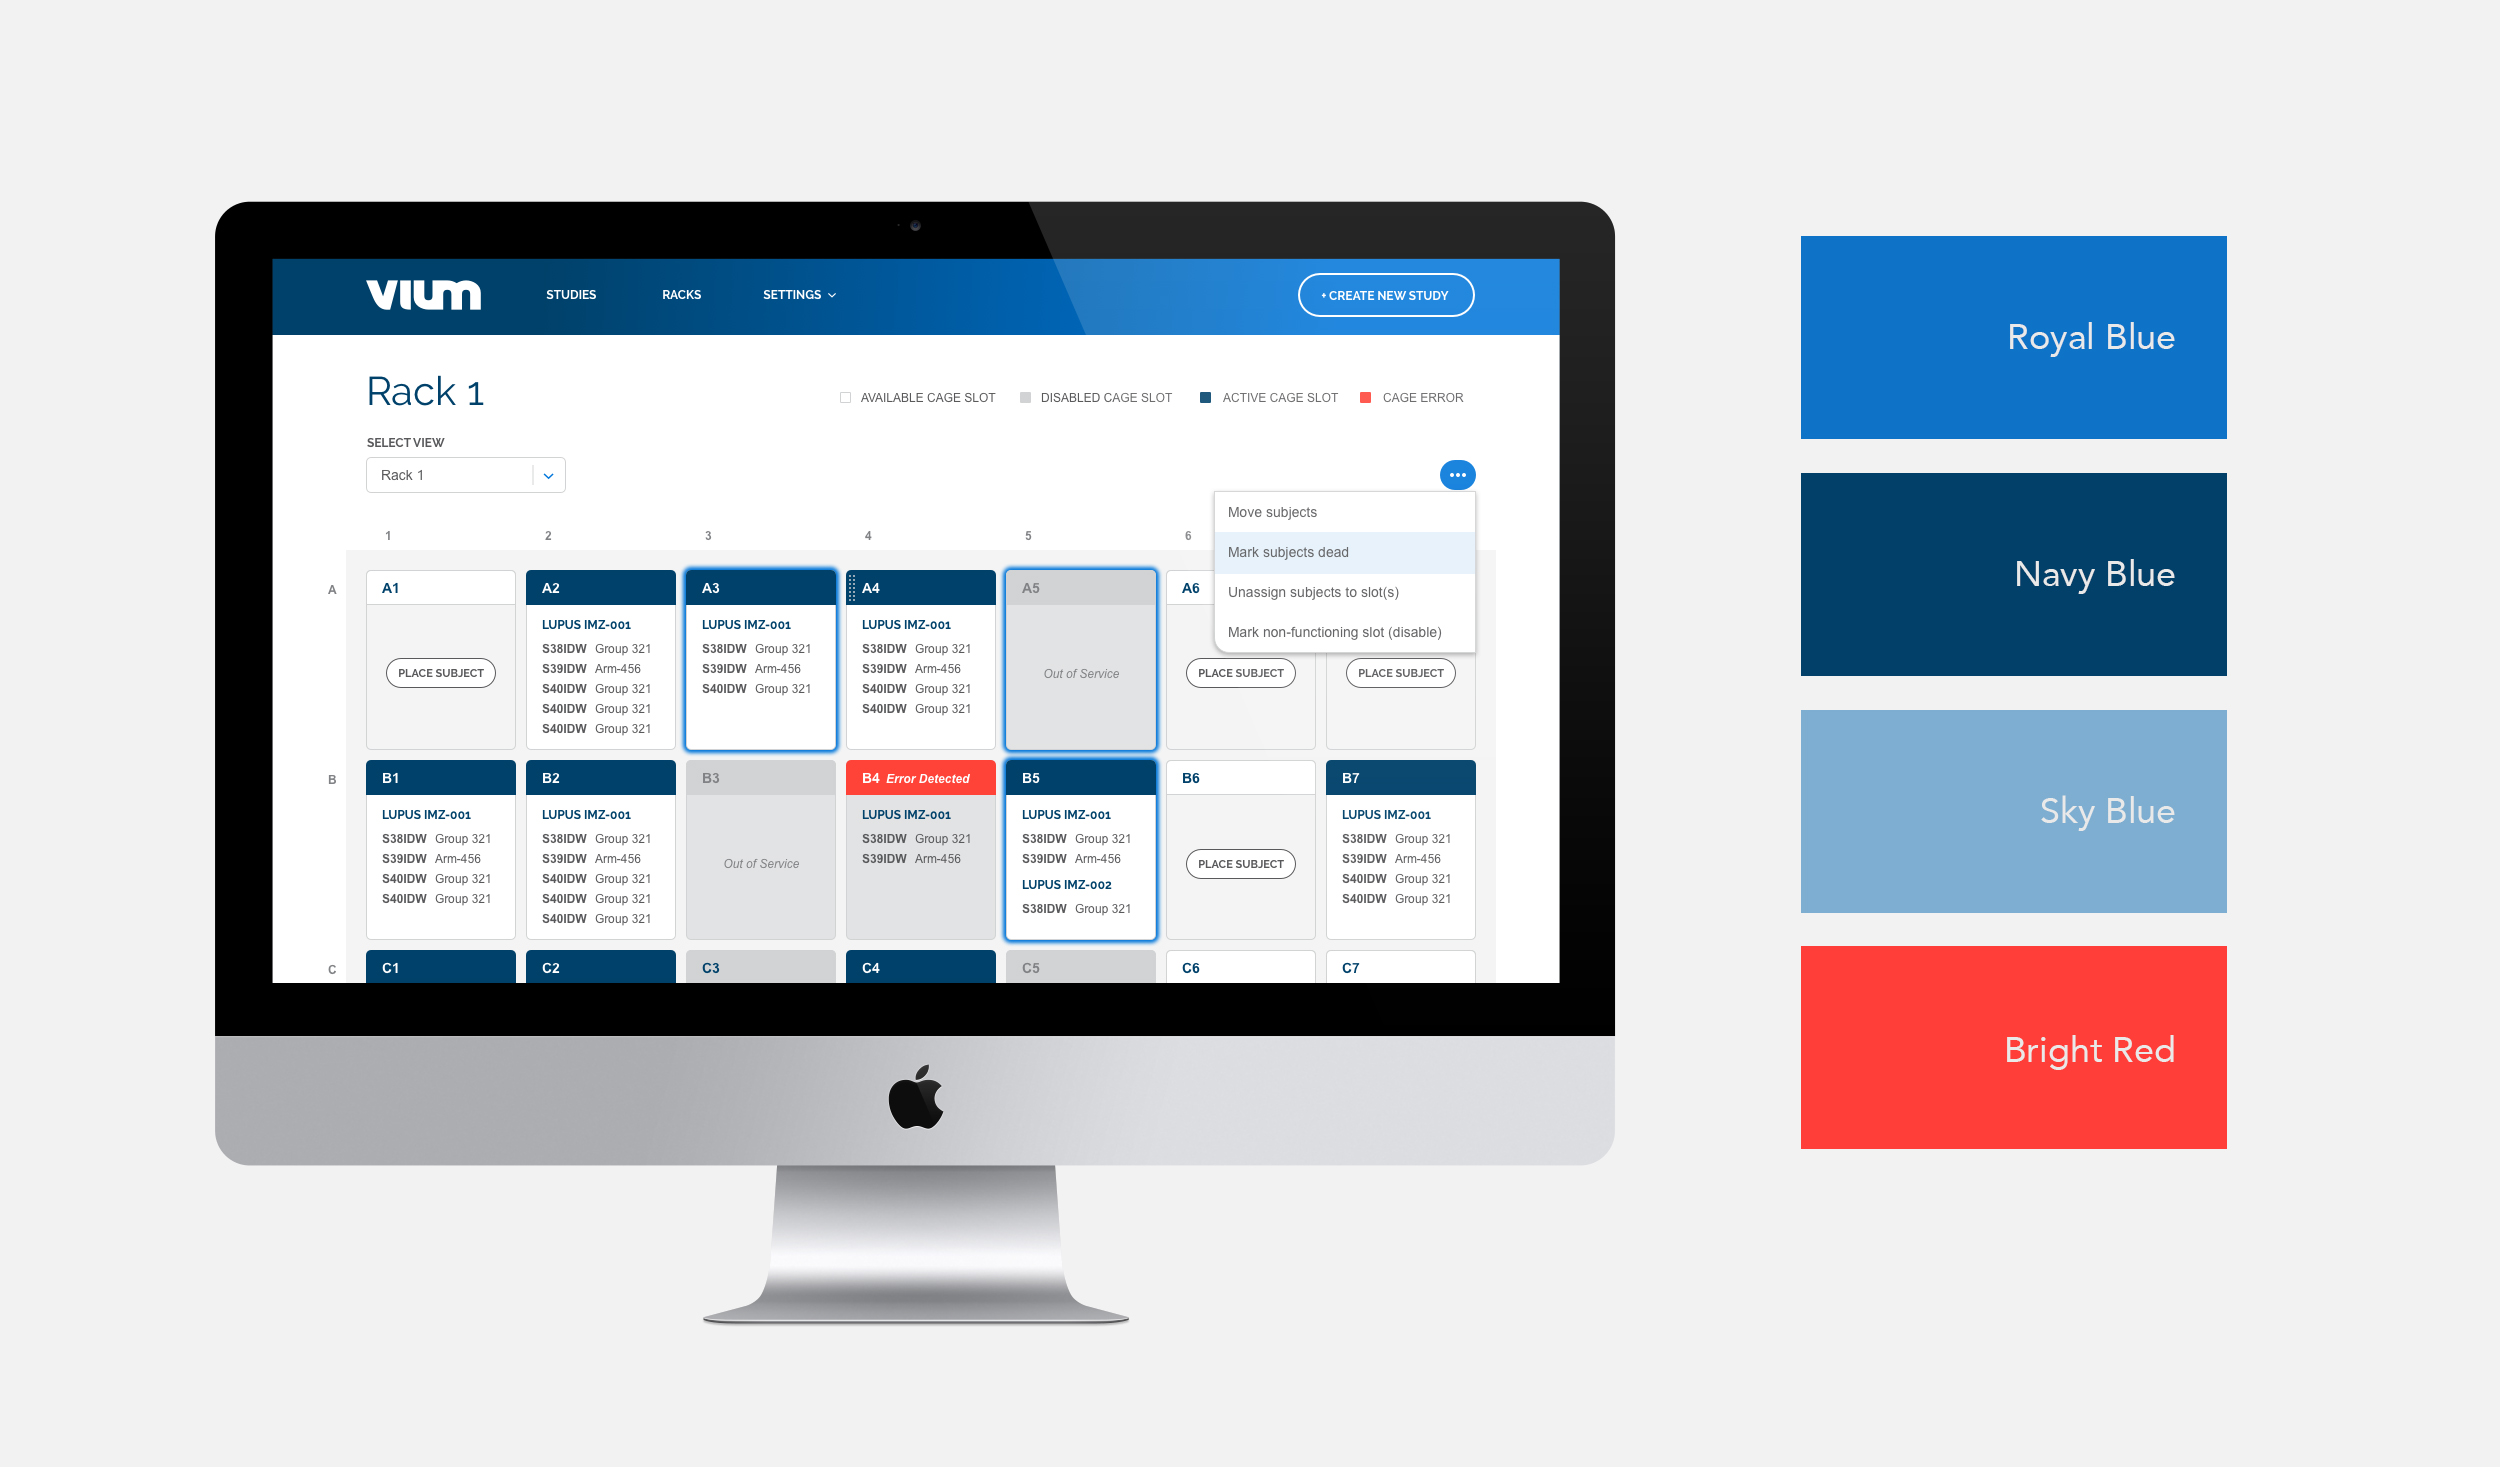
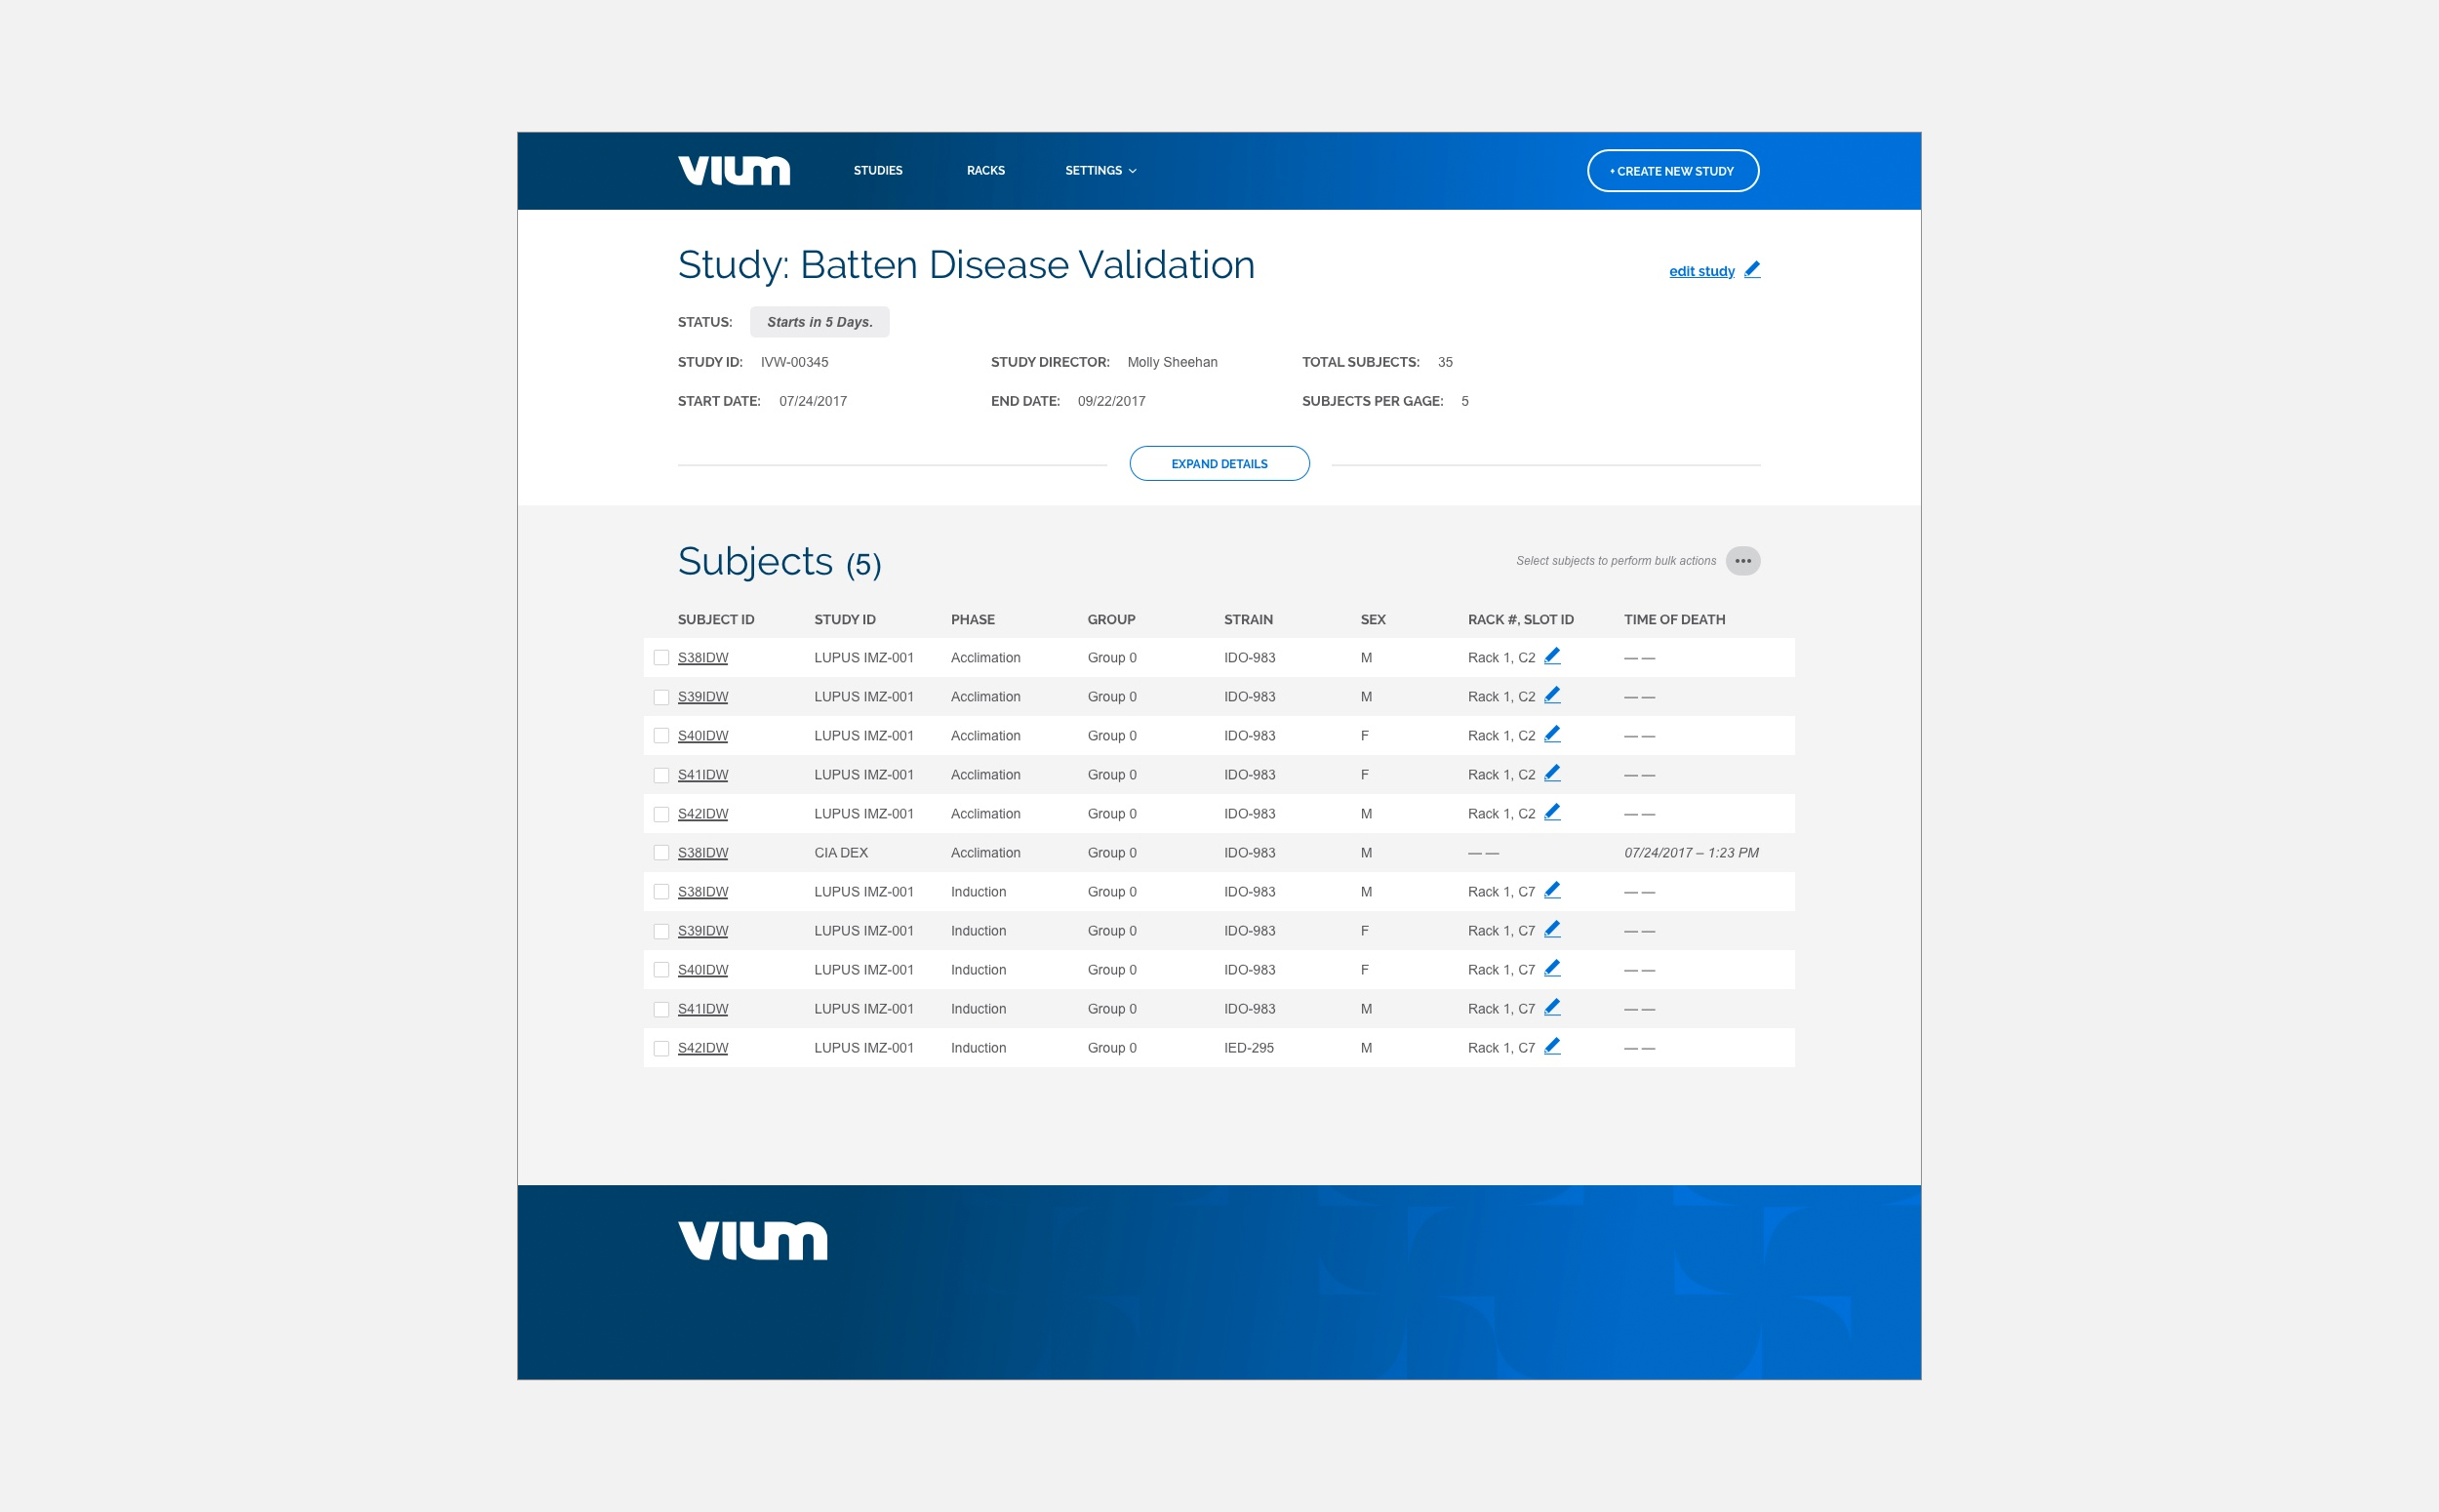
Final product with design team
Taking a product from concept to launch
Triaging new features
Inevitably, people will have different ideas for what ought to be first on the product roadmap. One person wanted an alert system, another wanted an automated QA system, and another was dissatisfied with the font choice. As the main liaison between engineering, quality assurance, marketing, sales, and business development, my job was to evaluate the incoming feature requests from each of these parties. It is important not to take all of these requests and go into a corner and prioritize them by yourself. Building a great product requires gathering all of the knowledge that is distributed in your teams’ heads.
De-shameify failure
Early on in the development process, several engineers were feeling demoralized that some features they had built did not line up with user needs during the testing phase. The main question here is: Could we have known what we have wanted to know without building it? If you could have known what you wanted to know, then there was no point in building that feature you're throwing away. If you couldn't have known those things, you weren't clear about whether a feature is for prototype or for production and setting those expectations for your engineers.
Expectations are key, especially in a rapidly moving environment where features are constantly being developed and thrown away, you must make it clear that the goal is not to build perfect things all the time. We are building things, taking feedback fast, and leaving a lot on the cutting room floor.
Design alongside your engineers
During the design process, don't solely design in isolation with your users, but also talk with your engineers. Being a great designer requires you to be empathetic, not only to users or clients, but to your engineers as well. As a product designer, you are responsible for sharing designs early and often with engineers. That does not mean it has to be nicely packed and polished. It could be a rough prototype. Truly groundbreaking products are a combination of great design and technical breakthrough.